China’s currency devaluation is a confirmation that the world’s second-largest economy could be on the verge of an economic collapse. At least, that’s the opinion of renowned analyst Jim Rickards.
“There’s no such thing as a one-time thing in currency wars,” he told Amanda Lang on CBC. “It won’t be their last move.” (Source: CBC News, August 14, 2015.)
The Chinese economy is slowing down faster than many economists thought before. China’s exports declined significantly and the country’s stock market crashed by more than 25%. In only a few weeks, this wiped out nearly $4.0 trillion of investors’ wealth. Authorities in China devaluated the yuan to boost the struggling economy and repeatedly said it would be a one-time devaluation.
“Currency wars have no logical conclusion except systemic reform or systemic collapse,” Rickards continued.
He believes currency wars which started in 2010 with devaluation of the U.S. dollar could last a long time. He suggested that there are only two solutions to make peace in the intensifying currency wars.
He also believes that the economic growth in the Chinese economy is lower than officials report. “The actual growth has been about four or five; today is down to two or three [percent].”
In respect to the possible interest rate hike in the U.S., Rickards thinks that the economic condition is much worse than people think and raising rates could create many more problems. “Raising rates are deflationary,” he warned.
The Federal Reserve is expected to raise the interest rate in September. But recent economic data suggested that the skepticism has grown over the Fed’s crucial decision.
“There is no way that the Fed can raise rates,” he added.
When the world’s largest economy has grown less than 1.5% this year and the second-largest economy is slowing down dramatically, the whole global economy may be on a verge of an economic collapse.
“We are in a global depression,” Rickards concluded. “The whole world is slowing down.”
Blogs, newsletters, and inboxes are cluttered with dire warnings about an event in October 2015. That will supposedly overthrow the dollar as the global reserve currency and cause a catastrophic meltdown of the international financial system. In fact, nothing of the kind is about to happen.
There are important and significant events happening behind the scenes in the international monetary system. Monetary elites are meeting in Washington, Beijing and Lima, Peru. Decisions are being made that will impact global capital markets in the years to come, and there is a plan underway to solve the global debt problem by stealing your money through inflation.
But elites do not operate on the big bang theory. They do not announce radical changes overnight. They prefer to make small moves, year after year, through boring technical changes that few notice or understand. The elites have a plan to take your money. Yet they prefer a slow orderly approach, opposed to a rapid disorderly approach.
Here is a step-by-step walkthrough of what is really happening. You should not be frightened by the October scare tactics. You should be concerned about this long-term elite plan to destroy your wealth.
The centerpiece of the elite plan to wipe out debt and destroy wealth is the world money issued by the International Monetary Fund, the IMF. This world money is called the special drawing right, or SDR.
The SDR is actually not that complicated. The Federal Reserve can print dollars, the European Central Bank (ECB) can print euros and the IMF can print SDRs — it’s that simple.
The main difference is that we can keep dollars or euros in our bank accounts or wallets, but SDRs are for countries only. They are added to national reserves by the IMF. SDRs can be swapped for dollars, euros, yen or other major currencies using a secret trading facility inside the IMF in Washington. So the inflationary potential of printing trillions of SDRs is the same as printing trillions of dollars or euros once the recipients make the swap.
The main difference between SDRs and dollars or euros is that no one is accountable. When the IMF floods the world with SDRs, you won’t be able to blame the Fed or ECB. Few people will have any idea what’s happening. They’ll just find out the hard way that their savings have been wiped out by inflation.
With that as background, let’s look at a chronology of coming events. As events unfold, you’ll be able to see them in the proper sequence and perspective. We’ll be covering each in future issues, in our five recommended articles every Monday and in our live monthly briefings. Here’s the calendar: Sept. 17, 2015 — The Fed’s FOMC announces policy changes in interest rates September 2015 (exact date TBA) — President Xi of China visits White House Oct. 9, 2015 — IMF annual meeting in Lima, Peru November 2015 (exact date TBA) — IMF Executive Board discusses “new” SDR Sept. 30, 2016 — New SDR goes into effect.
The first thing to notice about this schedule is that it blends events from the Fed, the White House and the IMF. That’s a reflection of the fact that the IMF is closely coordinating its efforts with central banks and heads of state.
In the past, the U.S. Treasury was the primary agency involved with the exchange value of the dollar. The Fed focused on the U.S. economy but did not involve itself with the dollar in international markets. That has changed.
When I met Ben Bernanke in Korea recently, he told me he was heavily involved in discussions with the IMF in 2009 and 2010 on a variety of issues including IMF voting rights, issuance of SDRs, U.S. funding of the IMF and an increased voice for China. This four-way interaction of the White House, Fed, Treasury and IMF is now well entrenched.
Right now, traders and investors are focused on the Sept. 17 Fed meeting. Most observers expect the Fed to raise interest rates at that meeting. Fed Chair Janet Yellen has given markets little reason to think otherwise.
But the data tell another story. China’s growth is collapsing and the world is slowing down with them. The U.S. is not immune to this global slowdown. The Fed has an inflation goal of 2%, but the inflation measures watched most closely by the Fed are nowhere near that. The core personal consumption expenditure index is about 1.3%, is trending down and has not been over 2% since 2008.
The U.S. employment cost index, another potential inflation measure, is also trending down and recently collapsed to a 0.2% level. Average hourly earnings have increased at an annual rate of 1.75–2.25% since 2012 and have lately moved down; after adjusting for inflation, those earnings have shown about zero real gains.
In short, Yellen’s entire dashboard is blinking red saying, “No inflation, no wage pressure and no reason to raise rates!”
But there’s another reason Yellen won’t raise rates in September, and it brings us back to the SDR story.
Right now, the value of one SDR is determined by reference to the dollar, euro, yen and sterling under a mathematical formula. China would like their currency, the yuan, to be included in that basket.
By itself, including the yuan in the SDR basket will not disrupt the international monetary system and will not overthrow the dollar as the leading global reserve currency. But it is an important sign of respect and does represent enhanced prestige, which China desperately wants.
Tomorrow, we’ll discuss what they have to do to be admitted, over what timeline, and what it means for you. Stay tuned…
Economic Crisis in America and Europe & Crisis Oil Prices Jim Rickards on Economic Crisis in America and Europe & Collapse Oil Prices Gerald Celente: The Next Financial Meltdown? WW3? Breakdown of Society?
‘How many times have you heard the phrase “bond bubble” in the past three years?
‘It seems that every time you turn on financial television or go to a financial website, there’s an analyst warning you about a bond bubble about to burst. The commentary usually consists of the observation that “interest rates are near an all-time low” and “have nowhere to go but up.”
‘There’s not much more to the analysis than that. In fact, interest rates are near all-time highs and could drop significantly, setting off one of the greatest bond market rallies in history.’
‘The next financial collapse, already on our radar screen, will not come from hedge funds or home mortgages. It will come from junk bonds, especially energy-related and emerging-market corporate debt.
‘The Financial Times recently estimated that the total amount of energy-related corporate debt issued from 2009–2014 for exploration and development is over US$5 trillion. Meanwhile, the Bank for International Settlements recently estimated that the total amount of emerging-market dollar-denominated corporate debt is over US$9 trillion’.
Most economic theories that attract a large and devoted following are sooner or later victims of their own success. The quantity theory of money is a good example. This theory is the basis for a school of economics known as monetarism, which has had a powerful influence on central banking since the 1970s.
In its simplest form, the quantity theory of money says that money supply times the velocity of money equals nominal GDP. Velocity is just a measure of how quickly each printed dollar turns into a dollar of goods or services.
If everyone stays home and leaves their money in the bank, velocity is zero. If people go shopping, and those who receive the money spend it too, then velocity grows.
Nominal GDP is the gross dollar value of goods and services. It is broken into two parts. One part represents real value and the other represents inflation or deflation.
As a simple mathematical equation, the theory is written as M * V = P * Q, where M is money supply, V is velocity, P is a price index and Q is real GDP.
Most economists agree that long-run potential growth in a developed economy such as the United States is about 3%. They also agree that price stability is a desirable goal and that neither inflation nor deflation should play much of a role in spending and investment. Monetarists, staring with Irving Fisher in the 1920s and continuing through Milton Friedman in the 1970s, believed that velocity was constant.
Using these inputs of 3% real growth, price stability and constant velocity, monetarists concluded that a slow, steady increase in the money supply — just enough to accommodate real growth — would produce maximum real growth with no inflation or deflation. This is central bank nirvana.
Of course, reality is messier than the theory implies, and there are leads and lags in the response to monetary policy. Real growth could be higher or lower than 3% for certain periods. But the basic idea that steady monetary growth could produce steady economic growth was taken as gospel by Friedman and his followers.
There was only one problem with this neat, tidy monetarist theory. Like a lot of economic theories, it worked better in the faculty lounge than in the real world. In particular, one of the core assumptions — that velocity is constant — turns out to be false.
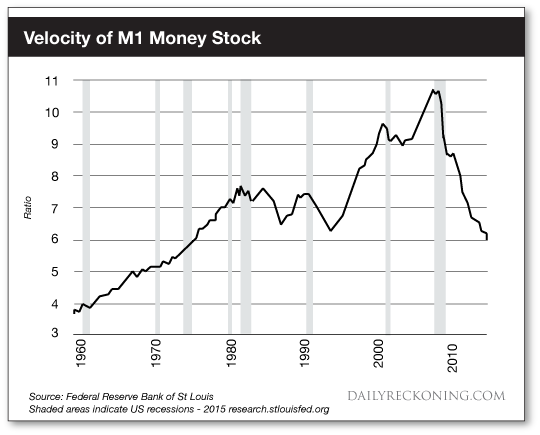
As Figure 1 below shows, velocity varies widely over time. The velocity of the M1 money supply rose from about 4 in 1960 to 7.5 in 1980, before falling to 6.3 in 1993. Then it rose steeply to 10.6 by 2008, before it plunged sharply to 6 again in 2015. It is still falling today.
This plunge in velocity explains why Federal Reserve money printing since 2008 has not produced much inflation. Many analysts and bloggers have been saying for years that Fed money printing would produce an outbreak of inflation. If velocity actually were constant, the 300% increase in the Fed’s balance sheet would have produced massive inflation by now.
The collapse in velocity shows why that has not happened. The money is available, but people are not spending it. Instead, they are saving it or paying off debts — a form of deleveraging.
The quantity theory of money is a useful tool for conducting thought experiments about alternative scenarios because it sets certain important economic variables in a relationship with others. But as a guide to policy or as a forecasting tool, it has little value because one of its key variables — velocity — is independent of the others and difficult to predict.
In order to understand velocity, we have to move out of economics and into the realms of technology and psychology.
Velocity depends on psychology above all. If people feel certain about their future incomes, job security and the economy in general, they are much more likely to borrow and spend. Conversely, if they are worried about their jobs and unsure about public policies like tax rates and health care costs, they are more likely to save and pay down debt.
This dynamic is different than the fictitious “wealth effect” that central bankers rely on. The wealth effect says that by offering zero rates of interest on bank deposits, savers will channel investment into stocks and real estate instead. The resulting increase in asset values will make people more likely to spend. Research shows that this is mostly nonsense.
The impact of channeling investment into stocks and real estate with artificially low rates produces asset bubbles. When the bubbles burst, confidence is shattered and velocity declines even more. This is clearly visible in Figure 1 where the velocity drop started with the LTCM crisis in 1998 and the dot-com crash in 2000. Then, after another round of easy money and a velocity rebound, it plunged disastrously again in 2008.
Velocity is mostly about confidence. When confidence in the future is low, as it is now, velocity declines and deflationary pressures persist. Confidence is likely to be weak at least through the 2016 elections, and perhaps beyond, because of policy stalemates between the White House and Congress.
Technology also plays a role in causing deflation. As technology drives prices lower, consumer expectations shift. Lower prices become the norm, not the exception. Consumers are no longer in a hurry to buy things before prices go up. Instead, they are content to wait until prices go down. This waiting reduces velocity even more and feeds on itself as lower prices produce more waiting, which causes even lower prices.
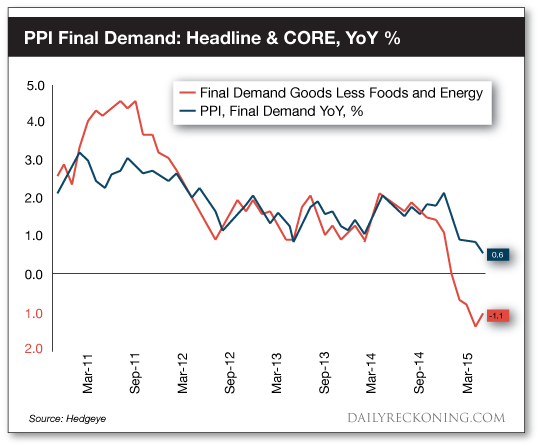
These deflationary price pressures are seen clearly in Figure 2, which shows the headline and core producer price indexes since November 2010. The overall index is already in deflationary territory, and the core index is moving in that direction.
Source: Hedgeye
The impact of technology on prices comes from two distinct trends — optimization and disintermediation. Optimization refers to a host of linear programming and similar modeling techniques that show companies how to produce more with less. By finding efficiencies in logistics, scheduling, inventory management and supply chains, companies can pass the savings along to customers in the form of lower prices.
Disintermediation refers to the disruptive process by which new companies, mostly Web-based, connect sources of supply and demand by going around traditional brokers, gatekeepers and agents.
Examples include companies like SoFi, which provides private student loans without banks, and Amazon, which provides shopping without stores. It has been remarked that Uber is the world’s largest taxi company but owns no taxis; Airbnb is the world’s largest lodging company but owns no real estate; and Facebook is the world’s largest advertising company yet provides no content.
All of these companies are not only disrupting existing business models but are lowering costs to consumers in the process. This process feeds expectations of lower prices in the future and further reduces velocity and increases deflationary pressures.
For now, the Federal Reserve is stymied. The psychological, technological and demographic trends causing deflation are not going away. The Fed cannot tolerate deflation because it increases the real value of debt and jeopardizes the banks. The Fed will be forced to return to its inflation tool kit of quantitative easing, currency wars and perhaps “helicopter money” in the year ahead.
These dominant economic trends — natural deflation countered by policy inflation — produce a rich set of indications and warnings.
These models use complexity theory and behavioral psychology, among other tools, to identify trends in their early stages and to foresee companies that are more likely to succeed or fail based on those trends.